1.107 Calian-Decimator
This page describes the Calian-Decimator device driver and the device window for this device. The driver supports Decimator D3 and D4 spectrum analyzers by Calian.
Device window pages
The following table shows which device window pages are available with this individual device type. Tool-bar functions not mentioned here are described at the general description of device windows .
 --- The spectrum view.
 --- The main parameter page displays/controls the spectrum main analyzer settings like center frequency, span, etc. You get this page in it's own window beside the spectrum view if you click to 'SET' at the upper left corner of the spectrum view window.
 --- The faults page.
 --- The device info page.
 --- The maintenance page. The configuration parameters described below are set at this page.
Configuration parameters
At the maintenance page of the device window there are a couple of configuration parameters which must be set to make the software talk to the antenna controller.
| inputSelId |
The device driver is capable to monitor the position of a switch or signal matrix output which is used as an input selector for the spectrum analyzer. For each switch position a local oscillator frequency may be defined to translate the center / marker frequency display. At this field, enter the message ID of the switch to monitor. Example: 'S05.position'. Leave this field empty if you don't want to use the frequency translation feature. |
| inputNames |
At this field enter the list of possible selections for the switch that the driver monitors. The switch settings must appear as a comma separated list with no additional space characters. The position names exactly must match the particular settings of the switch device. Example: '11X,11Y,12X,12Y'. |
| inputLoFreqs |
At this field enter the local oscillator frequencies for each switch position, appearing in the same order as the corresponding position names above. Example '10000,10000,11300,11300'. |
| title |
If you enter a text into this field, the text is displayed as a title in the spectrum view. You may use this to label the spectrum view. |
The spectrum view
The spectrum view shows the spectrum analyzer's output in a similar format as the local display would do. The display shows the measured spectrum (white) in front of a graticule and a summary of instrument settings.
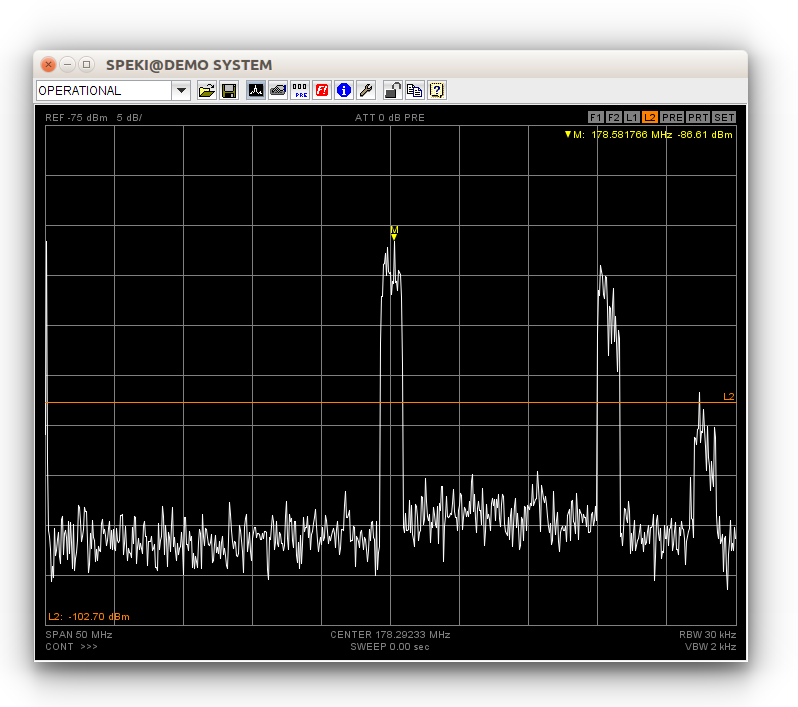
Clicking into the spectrum display activates the marker. You may drag the mouse with the button held down to see a reticule which follows the spectrum curve. This helps to place the marker manually to peaks. More about marker measurements you find at the next paragraph below.
At the upper left corner of the spectrum view you find three 'buttons' which activate additional function when you click to one of them.
- PRE --- Launches a separate window showing the instrument memory page (not available with the D3/D4 spectrum analyzers)
- PRT --- Opens the printing dialog, lets you print out the actual spectrum display.
- SET --- Launches a separate window showing the instrument settings page.
Marker handling
The spectrum view supports two markers. The main marker is that one provided by the instrument itself. The spectrum view colors this marker yellow. You may set the marker manually by clicking with the left mouse button into the spectrum display. While you hold down the mouse button, a reticule is shown which helps you to place the marker precisely. The instrument settings page provides some common marker functions like 'peak search' or 'marker to center'. These function operate on this main marker.
Additionally the spectrum display provides a delta marker function. To use this function, first place the marker to the location you want to become the reference for the delta measurement. Then set the marker to a second location using the right mouse button. This stores the previous marker location as reference (now shown green) to the actual marker location. You may do several delta measurement with the same reference point placing the marker with the right mouse button. Also the peak search and next peak functions work as you might expect. As soon as you place a marker with the left mouse button, the reference point and the delta display gets deleted.
As the marker is based on the instrument's internal marker function, the response to your mouse clicks may be somewhat delayed, specially with a slow communication line. Using the single sweep mode when setting markers improves the performance significantly.
Sweep handling
Viewing the output of a spectrum analyzer at a remote place requires a quite large amount of data to be transferred. Depending on system limitations like the capacity of communication lines this restricts the display update rate to value much lower than the rates you can achieve locally at the instrument.
The spectrum analyzer device driver always operates the instrument in 'single sweep' mode. It manually (i.e. with a remote command) triggers a sweep, when the sweep has finished the trace data is read out and sent to the user interface. The continuous sweep mode selectable at the M&C user interface is implemented in the device driver by repeatedly performing the sequence described above.
Unlike the instrument's local display, the spectrum view shows complete sweeps only. With long sweep times you will find the display frozen until the sweep has completed ans the trace data has been transferred to your user interface. With short sweep times, the maximum sweep rate will be limited by the maximum rate the M&C system is capable to handle and to transfer to the user interface rather than by the sweep time itself.
When you change instrument parameters at the M&C user interface, the device driver automatically triggers a new sweep if the driver is in single sweep mode. With a slow VLC and/or a slow communication line you will see a noticeable delay between the parameter change an the screen update.
The D3/D4 spectrum analyzers black all communication while they take a measurement (sweep). With smaller RBW settings this may take some seconds. For this reason the communication timeout while reading a measurement is 30 seconds while other commands already time out after 2 seconds.
Display lines
The spectrum display provides four display lines, two horizontal and two vertical lines. The display lines are named F1,F2 and L1,L2 where 'F' stands for frequency and 'L' for level. The display lines are purely implemented in the spectrum display widget, they do not appear on the spectrum analyzer's local display.
The display lines may individually switched on/off, the display line value may either be entered numerically or the lines may be dragged by the mouse in the spectrum display:
At the top of display area, there are four small buttons labelled F1/F2/L1/L2 which control the appearance of the four display lines.
- Clicking to one of the buttons with the left mouse button enables this display line. If previously disabled, the display line is now 'selected', the line and the button are yellow. Clicking again with the left mouse button toggles between the selected and unselected (orange) state.
- Clicking to a button with the right mouse button disables this display line, switched it off.
- The actually selected display line may be dragged do any position within the diagram area.
- While a display line is selected, the normal marker operation is suspended. The marker is shown dimmed and cannot be set with the mouse. To acces the marker again, click once to the display line button which actually appears yellow.
In the parameter panel associated with the spectrum display, the values of the display lines may be set numerically, each display line may be switched on or off individually.
When embedded into user screens at a small size (below 450 pixel width), the spectrum display shows no buttons for display lines as they would interfere with other status information in the display. In such a case either set the display lines numerically or use the standard pop up spectrum display to set the display lines with the mouse. display line parameter are synchronized across multiple display widgets for the same spectrum analyzer, so you can use another, lager instance to set the display lines with the mouse.
Min/Max hold and averaging
The spectrum display window also provides a MIN-HOLD/MAX-HOLD/AVERAGING function. This function is controlled by the 'display mode' parameter at the settings page (or window) for the spectrum analyzer. The following settings are supported:
- NONE --- The display window only shows the each actual sweep (white).
- MAX-HOLD --- The display shows each actual sweep (white) and the maximum values which were found since this mode was enabled (red).
- MIN-HOLD --- The display shows each actual sweep (white) and the minimum values which were found since this mode was enabled (cyan).
- MIN/MAX-HOLD --- The display shows each actual sweep (white) and both, the minimum (cyan) and the maximum (red) values.
- AVG --- The display shows each actual sweep (white) and the averaged values of all sweeps since this mode was enabled. The annotation in the display marking the AVG mode is followed by the number of sweep already averaged.
Preset handling
The Calian-Decimator driver provides the standard sat-nms device preset method in a slightly modified way, optimized for a spectrum analyzer's behaviour. If you store a device preset, all those "coupled functions" parameters are skipped which are marked as AUTO. When the preset gets applied, such a parameter is not explicitely set, the spectrum analyzer itself chooses the proper value for this parameter. Additionally the parameters of a device preset are applied in a sequence which corresponds to the dependencies of "coupled functions" parameters.
The advantage of this method is, that sat-nms device presets are stored at a central place, a preset recorded with one device may be applied to any other one. As the spectrum analyzer driver only implements a "standard" subset of spectrum analyzer parameters, recorded presets are mostly compatible between devices from different vendors. However, you should be aware that applying a sat-nms device preset only sets a couple of parameters at the device, it does not recall a complete setup like the internal memory function of the spectrum analyzer does. In some cases it may be necessary to apply a "INSTR PRESET" first, to initialize the spectrum analyzer to a defined state.
How to configure the driver
The Decimator D3/D4 spectrum analyzers are controlled via a TCP connection at port 9784. You will configure the spectrum analyzer as the only device at an interface set to the device's IP address and port 9784. To achieve fast display updates, the IDLE time of the interface should be set to a value 100-500 msecs, depending on the communication speed to the device.
Variables defined by this device driver
| info.driver |
TEXT |
R/O |
StringRange R/O |
| lowLevel.cmd |
TEXT |
|
StringRange |
| lowLevel.reply |
TEXT |
R/O |
StringRange R/O |
| faults.99 |
ALARM |
R/O |
AlarmFlagRange R/O (Communication) |
| faults.commstat |
TEXT |
R/O |
StringRange R/O |
| info.type |
TEXT |
R/O |
StringRange R/O |
| info.port |
TEXT |
R/O |
StringRange R/O |
| info.frame |
TEXT |
R/O |
StringRange R/O |
| info.hwrevision |
TEXT |
R/O |
StringRange R/O |
| info.swrevision |
TEXT |
R/O |
StringRange R/O |
| info.serial |
TEXT |
R/O |
StringRange R/O |
| info.screen |
TEXT |
R/O |
StringRange R/O |
| info.inputs |
INTEGER |
R/O |
IntegerRange R/O (0 .. 0) |
| info.lofreq |
FLOAT |
R/O |
DoubleRange R/O (0.000 .. 0.000) |
| info.memories |
TEXT |
R/O |
StringRange R/O |
| info.sweepsPerSec |
FLOAT |
R/O |
DoubleRange R/O (0.0 .. 0.0) |
| info.pdfilter |
TEXT |
R/O |
StringRange R/O |
| info.temperature |
FLOAT |
R/O |
DoubleRange R/O (0 .. 0) |
| config.inputSelId |
TEXT |
SAVE SETUP |
StringRange |
| config.inputNames |
TEXT |
SAVE SETUP |
StringRange |
| config.inputLoFreqs |
TEXT |
SAVE SETUP |
StringRange |
| config.title |
TEXT |
SAVE SETUP |
StringRange |
| internal.tick |
TEXT |
R/O |
StringRange R/O |
| internal.name1 |
TEXT |
R/O |
StringRange R/O |
| internal.name2 |
TEXT |
R/O |
StringRange R/O |
| internal.name3 |
TEXT |
R/O |
StringRange R/O |
| internal.name4 |
TEXT |
R/O |
StringRange R/O |
| internal.name5 |
TEXT |
R/O |
StringRange R/O |
| internal.name6 |
TEXT |
R/O |
StringRange R/O |
| internal.name7 |
TEXT |
R/O |
StringRange R/O |
| internal.name8 |
TEXT |
R/O |
StringRange R/O |
| internal.choices |
TEXT |
R/O |
StringRange R/O |
| internal.initMessage |
TEXT |
R/O |
StringRange R/O |
| title |
TEXT |
R/O |
StringRange R/O |
| input |
CHOICE |
|
EnumRange () |
| byname |
CHOICE |
|
EnumRange () |
| center |
FLOAT |
|
DoubleRange (0.000000 .. 0.000000) |
| span |
FLOAT |
|
DoubleRange (0.000000 .. 0.000000) |
| span.full |
TEXT |
NOPRESET |
StringRange |
| span.dn |
TEXT |
NOPRESET |
StringRange |
| span.up |
TEXT |
NOPRESET |
StringRange |
| start |
FLOAT |
NOPRESET |
DoubleRange (0.000000 .. 0.000000) |
| stop |
FLOAT |
NOPRESET |
DoubleRange (0.000000 .. 0.000000) |
| reflev |
FLOAT |
|
DoubleRange (0.00 .. 0.00) |
| reflev.up |
TEXT |
NOPRESET |
StringRange |
| reflev.dn |
TEXT |
NOPRESET |
StringRange |
| scale |
FLOAT |
|
DoubleRange (0 .. 0) |
| scale.up |
TEXT |
NOPRESET |
StringRange |
| scale.dn |
TEXT |
NOPRESET |
StringRange |
| atten |
FLOAT |
|
DoubleRange (0 .. 65) |
| atten.auto |
CHOICE |
|
EnumRange (AUTO FIX) |
| preamp |
CHOICE |
|
EnumRange DIS (OFF ON) |
| rbw |
FLOAT |
|
DoubleRange (0.000 .. 0.000) |
| rbw.up |
TEXT |
NOPRESET |
StringRange |
| rbw.dn |
TEXT |
NOPRESET |
StringRange |
| vbw |
FLOAT |
|
DoubleRange (0.000 .. 0.000) |
| vbw.up |
TEXT |
NOPRESET |
StringRange |
| vbw.dn |
TEXT |
NOPRESET |
StringRange |
| sweep |
FLOAT |
R/O |
DoubleRange R/O (0.004 .. 4000.000) |
| rbw.auto |
CHOICE |
|
EnumRange (AUTO FIX) |
| vbw.auto |
CHOICE |
|
EnumRange (AUTO FIX) |
| sweep.auto |
CHOICE |
R/O |
EnumRange R/O (AUTO) |
| trigger |
CHOICE |
SAVE |
EnumRange (CONT SINGLE) |
| trace |
GENERIC |
R/O |
ObjectRange R/O generic object |
| sweeping |
TEXT |
R/O |
StringRange R/O |
| display |
CHOICE |
|
EnumRange (NORM MAX HOLD MIN HOLD MIN/MAX HOLD AVG) |
| pdfilter |
CHOICE |
SAVE |
EnumRange (VBW AVG) |
| avg |
INTEGER |
SAVE |
IntegerRange (1 .. 255) |
| marker.x |
FLOAT |
R/O |
DoubleRange R/O (0.000000 .. 0.000000) |
| marker.y |
FLOAT |
R/O |
DoubleRange R/O (0.00 .. 0.00) |
| marker.xpos |
INTEGER |
|
IntegerRange (0 .. 0) |
| marker.mode |
CHOICE |
|
EnumRange (OFF ON) |
| marker.peak |
TEXT |
NOPRESET |
StringRange |
| marker.nextPeak |
TEXT |
NOPRESET |
StringRange |
| marker.toCenter |
TEXT |
NOPRESET |
StringRange |
| marker.toReflev |
TEXT |
NOPRESET |
StringRange |
| foffs |
FLOAT |
SAVE |
DoubleRange (0.000000 .. 0.000000) |
| foffs.en |
CHOICE |
SAVE |
EnumRange (OFF ON) |
| loffs |
FLOAT |
SAVE |
DoubleRange (0.00 .. 0.00) |
| loffs.en |
CHOICE |
SAVE |
EnumRange (OFF ON) |
| dl.x1.val |
FLOAT |
SAVE |
DoubleRange (0.000000 .. 0.000000) |
| dl.x1.en |
CHOICE |
SAVE |
EnumRange (OFF ON) |
| dl.x2.val |
FLOAT |
SAVE |
DoubleRange (0.000000 .. 0.000000) |
| dl.x2.en |
CHOICE |
SAVE |
EnumRange (OFF ON) |
| dl.y1.val |
FLOAT |
SAVE |
DoubleRange (0.00 .. 0.00) |
| dl.y1.en |
CHOICE |
SAVE |
EnumRange (OFF ON) |
| dl.y2.val |
FLOAT |
SAVE |
DoubleRange (0.00 .. 0.00) |
| dl.y2.en |
CHOICE |
SAVE |
EnumRange (OFF ON) |
| reset |
TEXT |
NOPRESET |
StringRange |
| store |
TEXT |
NOPRESET |
StringRange DIS |
| recall |
TEXT |
NOPRESET |
StringRange DIS |
| record |
TEXT |
NOPRESET |
StringRange |
| state.recording |
TEXT |
R/O |
StringRange R/O |
| memname.0 |
TEXT |
SAVE |
StringRange DIS |
| memname.1 |
TEXT |
SAVE |
StringRange DIS |
| memname.2 |
TEXT |
SAVE |
StringRange DIS |
| memname.3 |
TEXT |
SAVE |
StringRange DIS |
| memname.4 |
TEXT |
SAVE |
StringRange DIS |
| memname.5 |
TEXT |
SAVE |
StringRange DIS |
| memname.6 |
TEXT |
SAVE |
StringRange DIS |
| memname.7 |
TEXT |
SAVE |
StringRange DIS |
| memname.8 |
TEXT |
SAVE |
StringRange DIS |
| memname.9 |
TEXT |
SAVE |
StringRange DIS |
| memname.10 |
TEXT |
SAVE |
StringRange DIS |
| memname.11 |
TEXT |
SAVE |
StringRange DIS |
| memname.12 |
TEXT |
SAVE |
StringRange DIS |
| memname.13 |
TEXT |
SAVE |
StringRange DIS |
| memname.14 |
TEXT |
SAVE |
StringRange DIS |
| memname.15 |
TEXT |
SAVE |
StringRange DIS |
| internal.fmin |
FLOAT |
R/O |
DoubleRange R/O (0.0 .. 0.0) |
| internal.fmax |
FLOAT |
R/O |
DoubleRange R/O (0.0 .. 0.0) |
| internal.amin |
INTEGER |
R/O |
IntegerRange R/O (0 .. 0) |
| internal.amax |
INTEGER |
R/O |
IntegerRange R/O (0 .. 0) |
| internal.astep |
INTEGER |
R/O |
IntegerRange R/O (0 .. 0) |
| lband.center |
FLOAT |
|
DoubleRange (0.000000 .. 0.000000) |
| lband.marker.x |
FLOAT |
|
DoubleRange (0.000000 .. 0.000000) |
| faults.01 |
ALARM |
R/O |
AlarmFlagRange R/O (Device summary) |
| faults.02 |
ALARM |
R/O |
AlarmFlagRange R/O (Overload) |
| faults.03 |
ALARM |
R/O |
AlarmFlagRange R/O (Mixer cal.) |
| faults.04 |
ALARM |
R/O |
AlarmFlagRange R/O (Basebans cal.) |