2.25.4 Active alarms
The Active alarms tab lists all actually pending faults and warnings in the M&C. The Table automatically updates its content as the faults appear or disappear.
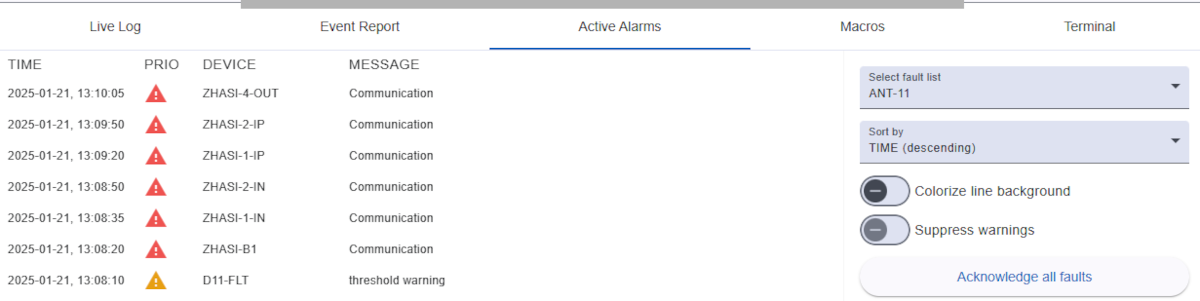
Table columns
- TIME: The time stamp when the event was originated
- NAK: The need acknowledgment mark. Messages showing a red exclamation mark in this column are fault messages which need to be acknowledged by the operator.
- PRIO: The message priority or severity. It also is a search criteria in the Event Report window. The following priority symbols may appear:
 This is an informational message (lowest priority)
 This is a warning message (medium priority)
 This is an fault message (high priority)
 This is an critical message (highest priority)
- SOURCE: The primary message source. This usually is the ID of the MNC or
BACKEND for events coming from a backend service or WEBAUTH for messages related to user authentication.
- DEVICE: The secondary message source. This gives a more detailed information about the source of the message. It is usually the name of the device in a MNC which caused the event. For messages from backend or authentication service the value is
SYSTEM.
- MESSAGE: The message text which describes the full details of the event.
Right toolbar
The toolbar buttons of the window let you select how the fault list displays the active faults:
- Select MNCs: Select an MNC name from the drop-down list for which you want to check faults. Primary M&C is selected as default.
- Sort by: The table content can sort by descending and ascending of it's time.
- Colorized line background: If checked, the background of each line gets background color as the icon red for faults or alarms and yellow for warnings.
- Suppress warnings: If checked, the table content suppresses all warnings and show only faults only. Otherwise faults and warnings are displayed.
- Acknowledge all faults: Acknowledge all faults marked with the red exclamation mark.