2.8 Device list
The device list page shows different type of information about installed devices. For example driver name, protocol, mode or fault state. You can choose one or multiple MNCs to search and list devices.
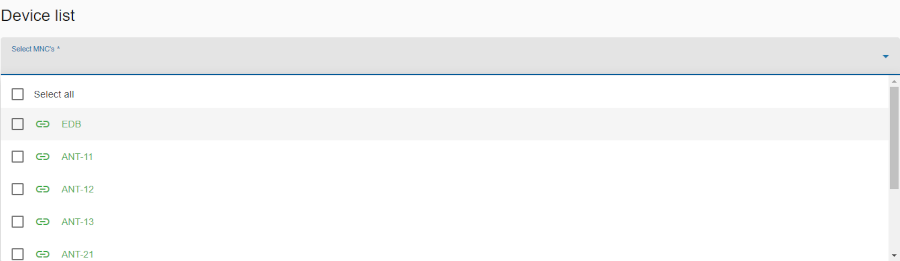
In the first step select one or more MNCs from the drop down list below the heading. The page will show a table of alle devices.
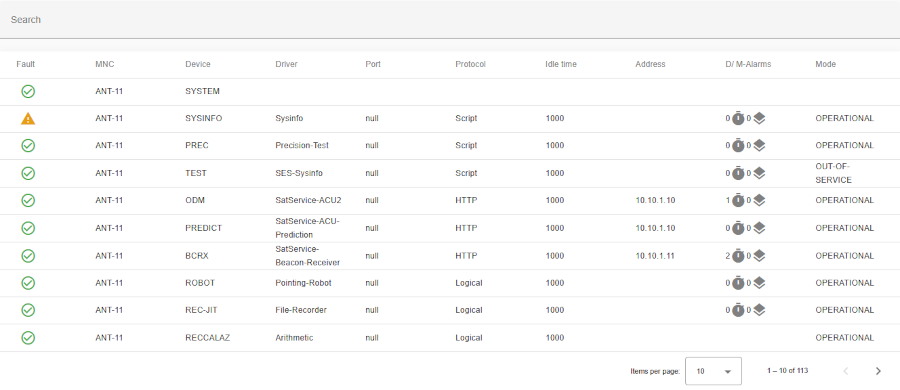
Search bar
- Located at the top of the table.
- Allows users to filter device list
- The search pattern will be used for a full text search in all columns of the table.
Header row
- You can sort rows in ascending or descending order by clicking on the column header (e.g. MNC, device, etc.).
- Sorting is applied to the entire dataset, not just the current page.
- The active sort order (ascending or descending) is indicated by an arrow or icon near the column name.
Table columns
- Fault: Current fault of device on MNC. If there is no fault, a green check icon appears, if there is a warning, an orange warning icon appears and if there is a summary fault, a red error icon appears.
- Functionality: On mouse hover on fault icons gives you detailed information.
- MNC: MNC name.
- Device: Device name.
- Driver: Device driver.
- Port: The communication port/interface.
- Protocol: The used protocol type.
- Idle time: The idle time in milliseconds.
- Address: Address.
- D/M-alarms: Delayed alarms are labelled with a clock icon and masked alarm with layers icon
- Mode: Current mode of device.
Bottom toolbar
- Pagination controls: Allows users to set the number of items displayed per page and navigate between pages.
Functionality