3.16.2.4.23 XY Chart
This element shows the relation of two numeric variables in an X/Y diagram, featuring a 'track' which shows the recent history of the values with a configurable depth. The update rate, the diagram scaling and much more is configurable with this screen element.
The X/Y chart display may be scaled to an almost arbitrary size, however the following limitations apply:
- The annotation labels which reflect the actual display settings are not scaled with the display element. If the element is very small, the labels may overlap and become unreadable.
- Resizing the X/Y chart display element is only possible in certain steps, the grid behind the curve is always made up of a number pixels in one dimension which is divisible by the configured number of diagram divisions without remainder. The screen editor software knows about this, snaps the size of the element to the next (smaller) valid size after you release the mouse button.
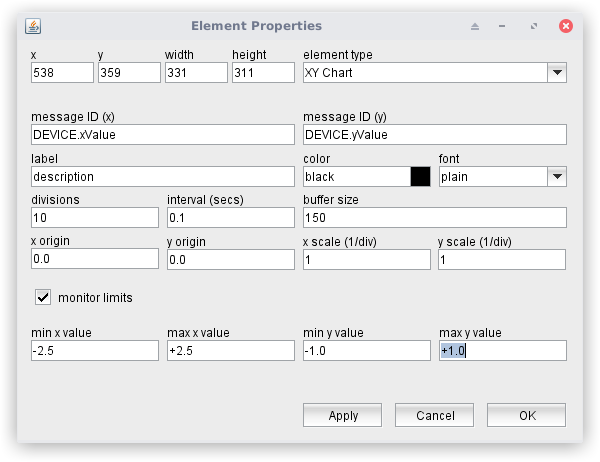
The attributes listed below may be configured to customize a display element of this type:
- messageID(x) message ID (y) --- The message IDs of the parameters to show.
- label --- The annotation label displayed above the X/Y chart
- color --- The color of the label displayed above the X/Y chart. Colors may be specified by standard color names like red / green / blue or using a hexadecimal RGB notation. '#FFFF00' for example specifies yellow. You may click to the color example field in order to open a color chooser dialog and select the color from there.
- font --- The font attribute sets the font of the label shown above the element.
- divisions --- The number of divisions shown in the diagram for both directions. You may enter arbitrary values here, but to achieve some readability, you are encouraged to us common values like 2 ('hair cross'), 4 or 10.
- interval --- The update time interval for the display in seconds. 0.1 means to add every 100msec a new value to the display and remove the oldest value from the buffer at the same time.
- buffer size --- The display maintains a "first in first out" buffer of a size defined with this parameter. The buffer provides a short time memory the display shows as a trace of past values. Values in the range 100-300 are a good choice, larger values may slow down the client application. Please note, that the buffer gets cleared when the window is closed.
- x origin y origin --- The origin values refer to the center of the diagram. Using an even number of divisions helps to identify the diagram center as the crosspoint of the middle grid lines
- x scale y scale --- The scale values are per division. with xorigin = 0.0 and x scale = 1.0 an x value of 1.0 gets displayed one division right of the diagram center.
- monitor limits --- With this mark checked, the display monitors the actual X/Y values to be within the limits defined below. The limit values are shown as a dark red rectangle. When the while the actual X/Y values exceed the limits, the disgram background becomes red.
- min x value max x value min y value max y value --- The limit values for X and Y to be checked.