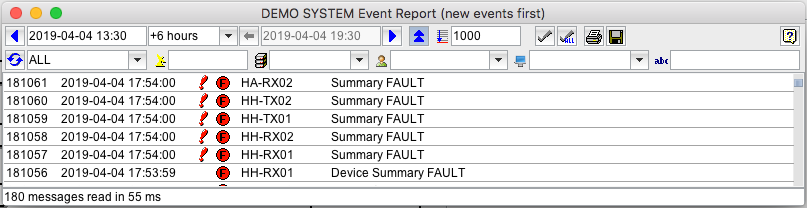
The Event Report window lets you generate filtered reports from the event database maintained by the NMS. This database contains all event (fault) messages issued by the VLCs during the last months (the exact depth of event storage is configurable during system installation).
The event report shown in the window gets automatically updated when you change the time range to display or the sort order. Changing the filter options in the second line of the toolbar does not automatically update the report, you have to click the reload button or press ENTER in one of the filter fields for this. This lets you combine various filter specifications without being interrupted by the generation of intermediate reports.
Data shown in the list columns
column --- description
1 --- The event ID. This is a unique number the software assigns to each event which arrives at the NMS.
2 --- The time stamp when the event was originated. The originating VLC sets this, so the time relies on the accuracy of the VLC's clock.
3 --- The 'need acknowledgment' mark. Messages showing a red exclamation mark in this column are fault messages which need to be acknowledged by the operator.
4 --- The message priority. The message priority decides on the urgency, the message gets delivered from the VLC to the NMS. It also is a search criteria in the Event Report window. The following priority symbols may appear:
 --- This is an informational message (lowest priority)
 --- This is a fault message (medium priority)
 --- This is an alarm message (highest priority, the VLC tries to deliver this immediately, regardless of the dial timing settings)
5 --- The primary message source. This usually is the ID of the VLC which issued the message. Messages marked with 'USER' or 'NMS' in this column have been generated locally in the NMS.
6 --- The secondary message source. This gives a more detailed information about the source of the message. It may be the name of the device in a VLC which caused the event.
7 --- The message text.
Tool-bar Functions
On top of the event report window, there is a 2-line toolbar which lets you control all aspects of what the event report shall contain.

The controls in the upper line between the two blue arrows define the time range to be displayed in the report. For this, the event report windows knows two different modes. One lets you define the time range as start time plus a duration picked from a list of commonly used values. The second mode lets you specify start and end time explicitly. The small button with the horizontal gray arrow symbol lets you switch between the modes. The gray arrow always points to the parameter which is actually active.
The blue arrow buttons enclosing this section of the tool bar let you increase or decrease the start point in increments of the selected duration.
A double click to the start or end time fields opens a calendar dialog window.

The button with the double blue vertical arrows on it toggles the order in which the events are shown. With the arrows down, the newest event is at the bottom of the list, when pointing up the list is ordered from newest to oldest. The default sort order is determined from a parameter set in the "client.properties" file located at the NMS or M&C server. Setting the key "gui.eventSortOrder" to "true" or "false" defines the default behavior of the event report window.
The entry field right of the sort order button defines the maximum number of events one report may contain. There is a default value for this (1000 in most cases), which is a good trade off between performance and the number of events displayed at a time. You may change this limit to your needs, but be aware: reports with millions of events may take some time to be collected.

These buttons lets acknowledge either the selected fault message only or all pending fault messages contained in the event log. Acknowledging a message is always logged as an additional event.

The 'print' and 'save' buttons are quite self-explanatory. 'print' sends the actual report to the printer using the system print dialog of your client computer. Depending on the operating system you are using, you probably have the possibility to preview the print and to select the pages of the report you actually want to be printed.
The 'save' button lets you save the actual report as a CSV file on your client computer. A file select dialog box pops up, you have to enter or select a file name and click 'save' in order to have the file actually stored. The columns of the CSV file are separated by semicolons, you may import this file for example into a spread sheet program of your choice.

The reload button forces a report to be generated once more, for example to include some new events which may have ocurred since the time when the report was created. During a long lasting query, the button turns into a red 'stop' button, you may click to this to abort a pending query.
The priority selector defines the priority (or type) an event must have to be listed in the report. The selection ALL displays all events. FAULT includes events which at least have fault priority. ALARM displays alarm messages only (see the description of alarm priorities above). The selection NOT ACK shows all messages which (still) need to be acknowledged.
This filter lets you filter messages along their primary source. The primary source of a message is the VLC in an NMS environment. For stand alone M&C systems this filter is actually not applicable.
Any non blank value in this field filters those events which have their primary source field (usually the originating VLC) set to this value. If you enter multiple words in this field, all messages are shown which contain all words in their primary source at an arbitrary position. The filter is not case sensitive.
If the first character in this field is '-', the filter gets inverted. Example: '-vlc0003' lists all events which do not come from vlc0003.
This filter lets you filter messages along their secondary source. The secondary source is usually the name of the device which caused the message. With M&C systems, the entry field for the filter is a combo-box suggesting all device names used in the system in a drop down list. You may enter free text anyhow.
Any non blank value in this field filters those events which have their secondary source field set to this value. If you enter multiple words in this field, all messages are shown which contain all words in their secondary source at an arbitrary position. The filter is not case sensitive.
If the first character in this field is '-', the filter gets inverted.

The user name filter lets you restrict the report to messages originated by a certain user. Login messages and messages logging the active change of a parameter are stored with the name of the user who is responsible for this event.
The user name filter is a combo box which lets you either type the name of the user or selected from a drop down list with all known user names at this system. The filter is not case sensitive. You may type only a part of the user name, the filter shows all messages containing this character sequence in their user name field.
Please note, that this filter - if not blank - suppresses all messages which have no user name stored. No faults, no warnings are displayed with this filter.
The client host name filter lets you restrict the report to messages originated from a certain client PC. Login messages and messages logging the active change of a parameter are stored with the origin (hostname or IP4 address) of the event.
The client host name filter is a combo box which lets you either type the name of the client computer or select it from a drop down list with all known client names at this system. The filter is not case sensitive. You may type only a part of the client host name, the filter shows all messages containing this character sequence in their host name field.
Please note, that this filter - if not blank - suppresses all messages which have no client host name stored. No faults, no warnings are displayed with this filter.

The last filter is applied to the message text. Any non blank value in this field filters those events which contain this value in their message text (partial match). If you enter multiple words in this field, all messages are shown which contain all words in their message text at an arbitrary position. "one two" as a message filter will match for example the message text "received two ones". The filter is not case sensitive.
If the first character in this field is '-', the filter gets inverted. Example: '-OK' lists all events which do not contain OK in the message text.
Remarks