9.97 CSM-Spectrum-Analyzer
This page describes the CSM-Spectrum-Analyzer device driver and the device window for this device.
The CSM-Spectrum-Analyzer device driver provides some sort of bridge which makes the spectrum analyzer device drivers contained in the sat-nms CSM software available as M&C/VLC devices. Using this type of device driver is the recommended way to connect a spectrum analyzer to M&C/VLC.
Actually there are five types of spectrum analyzers supported:
| Agilent ESA E44xx spectrum analyzers |
AgilentSpectrumAnalyzer |
GPIB or RS-232 |
| Advantec spectrum analyzers |
AdvantecSpectrumAnalyzer |
GPIB or RS-232 |
| Rohde & Schwarz FSC-3 spectrum analyzer |
FscSpectrumAnalyzer |
NI-VISA (TCPIP / VXI-11) |
| Rohde & Schwarz FSL-3 spectrum analyzer |
Fsl3SpectrumAnalyzer |
NI-VISA (TCPIP / VXI-11) |
| Rohde & Schwarz FSV-7 spectrum analyzer |
FsvSpectrumAnalyzer |
NI-VISA (TCPIP / VXI-11) |
| Rohde & Schwarz FSH-4 handheld spectrum analyzer |
FshSpectrumAnalyzer |
NI-VISA (TCPIP / VXI-11) |
| Rohde & Schwarz Spectrum Rider FPH handheld spectrum analyzer |
FphSpectrumAnalyzer |
NI-VISA (TCPIP / VXI-11) |
| LP Technologies LPT3000 spectrum analyzer |
|
|
| (for this device you find additional inormation at the end of this page) |
LPT3000SpectrumAnalyzer |
Serial via TCP/IP |
| Narda NPA 2500/3000/6000 spectrum analyzers |
NardaSpectrumAnalyzer |
Serial via TCP/IP |
| SED Calian Decimator D3 / D4 spectrum analyzers |
DecimatorD4SpectrumAnalyzer |
Serial via TCP/IP |
When using this driver, assigning and configuring the physical interface to the spectrum analyzer is done slightly different to other devices. Please read the paragraph "How to configure the driver" at the and of this chapter.
Device window pages
The following table shows which device window pages are available with this individual device type. Tool-bar functions not mentioned here are described at the general description of device windows .
 --- The spectrum view.
 --- The main parameter page displays/controls the spectrum main analyzer settings like center frequency, span, etc. You get this page in it's own window beside the spectrum view if you click to 'SET' at the upper left corner of the spectrum view window.
 --- This page gives you access to the first 16 instrument memories of the spectrum analyzer. Clicking to 'STO x' stores the actual instrument settings to this memory place in the device. Clicking to 'RCL x' recalls the selected memory.You may use the text field between the buttons to note a comment for this particular memory place. Unless the instrument settings which are stored in the device itself, the text is stored at the VLC/M&C system. Hence, if you replace the spectrum analyzer, the stored instrument settings are gone with the replaced device, the comments however are still present.Also this page is available as a separate window. click to 'PRE' at the upper left corner of the spectrum view to launch a 'preset' window without leaving the spectrum view.
 --- The faults page.
 --- The device info page.
 --- The maintenance page. The configuration parameters described below are set at this page.
Configuration parameters
At the maintenance page of the device window there are a couple of configuration parameters which must be set to make the software talk to the antenna controller.
| address |
The CSM interface / device address string. See the paragraph "CSM address specification" at the and of this chapter for details. |
| display |
This configuration parameter switches the local display of the spectrum analyzer on or off. Switching off the display improves the measurement speed of the analyzer in some situations. Please note, that some spectrum analyzers may ignore this parameter. |
| dispTimeout |
If you set this parameter to a non-zero value, the software will switch off the device's display automatically after the given number of minutes. |
| model |
Select the type of spectrum analyzer you want to control. |
| inputSelId |
The device driver is capable to monitor the position of a switch or signal matrix output which is used as an input selector for the spectrum analyzer. For each switch position a local oscillator frequency may be defined to translate the center / marker frequency display. At this field, enter the message ID of the switch to monitor. Example: 'S05.position'. Leave this field empty if you don't want to use the frequency translation feature. See chapter 'Fixed LO frequency' below if you have no input switch but you want to translate the frequency by a fixed LO frequency. |
| inputNames |
At this field enter the list of possible selections for the switch that the driver monitors. The switch settings must appear as a comma separated list with no additional space characters. The position names exactly must match the particular settings of the switch device. Example: '11X,11Y,12X,12Y'. |
| inputLoFreqs |
At this field enter the local oscillator frequencies for each switch position, appearing in the same order as the corresponding position names above. Example '10000,10000,11300,11300'. See chapter 'Fixed LO frequency' below if you have no input switch but you want to translate the frequency by a fixed LO frequency. |
| title |
If you enter a text into this field, the text is displayed as a title in the spectrum view. You may use this to label the spectrum view. |
The spectrum view
The spectrum view shows the spectrum analyzer's output in a similar format as the local display would do. The display shows the measured spectrum (white) in front of a graticule and a summary of instrument settings.
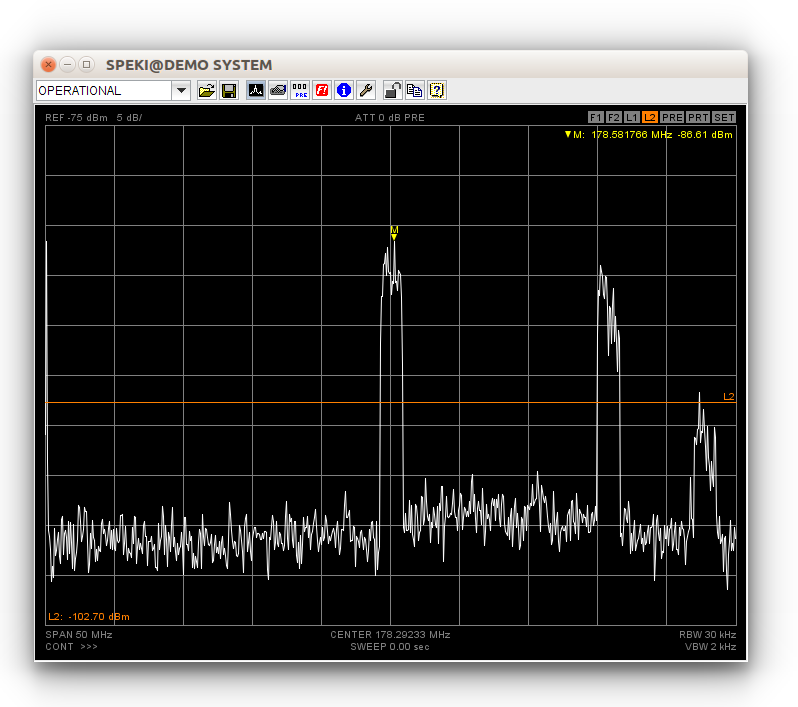
Clicking into the spectrum display activates the marker. You may drag the mouse with the button held down to see a reticule which follows the spectrum curve. This helps to place the marker manually to peaks. More about marker measurements you find at the next paragraph below.
At the upper left corner of the spectrum view you find three 'buttons' which activate additional function when you click to one of them.
- PRE --- Launches a separate window showing the instrument memory page.
- PRT --- Opens the printing dialog, lets you print out the actual spectrum display.
- SET --- Launches a separate window showing the instrument settings page.
Marker handling
The spectrum view supports two markers. The main marker is that one provided by the instrument itself. The spectrum view colors this marker yellow. You may set the marker manually by clicking with the left mouse button into the spectrum display. While you hold down the mouse button, a reticule is shown which helps you to place the marker precisely. The instrument settings page provides some common marker functions like 'peak search' or 'marker to center'. These function operate on this main marker.
Additionally the spectrum display provides a delta marker function. To use this function, first place the marker to the location you want to become the reference for the delta measurement. Then set the marker to a second location using the right mouse button. This stores the previous marker location as reference (now shown green) to the actual marker location. You may do several delta measurement with the same reference point placing the marker with the right mouse button. Also the peak search and next peak functions work as you might expect. As soon as you place a marker with the left mouse button, the reference point and the delta display gets deleted.
As the marker is based on the instrument's internal marker function, the response to your mouse clicks may be somewhat delayed, specially with a slow communication line. Using the single sweep mode when setting markers improves the performance significantly.
Sweep handling
Viewing the output of a spectrum analyzer at a remote place requires a quite large amount of data to be transferred. Depending on system limitations like the capacity of communication lines this restricts the display update rate to value much lower than the rates you can achieve locally at the instrument.
The spectrum analyzer device driver always operates the instrument in 'single sweep' mode. It manually (i.e. with a remote command) triggers a sweep, when the sweep has finished the trace data is read out and sent to the user interface. The continuous sweep mode selectable at the M&C user interface is implemented in the device driver by repeatedly performing the sequence described above.
Unlike the instrument's local display, the spectrum view shows complete sweeps only. With long sweep times you will find the display frozen until the sweep has completed ans the trace data has been transferred to your user interface. With short sweep times, the maximum sweep rate will be limited by the maximum rate the M&C system is capable to handle and to transfer to the user interface rather than by the sweep time itself.
When you change instrument parameters at the M&C user interface, the device driver automatically triggers a new sweep if the driver is in single sweep mode. With a slow VLC and/or a slow communication line you will see a noticeable delay between the parameter change an the screen update.
Display lines
The spectrum display provides four display lines, two horizontal and two vertical lines. The display lines are named F1,F2 and L1,L2 where 'F' stands for frequency and 'L' for level. The display lines are purely implemented in the spectrum display widget, they do not appear on the spectrum analyzer's local display.
The display lines may individually switched on/off, the display line value may either be entered numerically or the lines may be dragged by the mouse in the spectrum display:
At the top of display area, there are four small buttons labelled F1/F2/L1/L2 which control the appearance of the four display lines.
- Clicking to one of the buttons with the left mouse button enables this display line. If previously disabled, the display line is now 'selected', the line and the button are yellow. Clicking again with the left mouse button toggles between the selected and unselected (orange) state.
- Clicking to a button with the right mouse button disables this display line, switched it off.
- The actually selected display line may be dragged do any position within the diagram area.
- While a display line is selected, the normal marker operation is suspended. The marker is shown dimmed and cannot be set with the mouse. To access the marker again, click once to the display line button which actually appears yellow.
In the parameter panel associated with the spectrum display, the values of the display lines may be set numerically, each display line may be switched on or off individually.
When embedded into user screens at a small size (below 450 pixel width), the spectrum display shows no buttons for display lines as they would interfere with other status information in the display. In such a case either set the display lines numerically or use the standard pop up spectrum display to set the display lines with the mouse. display line parameter are synchronized across multiple display widgets for the same spectrum analyzer, so you can use another, lager instance to set the display lines with the mouse.
Min/Max hold and averaging
The spectrum display window also provides a MIN-HOLD/MAX-HOLD/AVERAGING function. This function is controlled by the 'display mode' parameter at the settings page (or window) for the spectrum analyzer. The following settings are supported:
- NONE --- The display window only shows the each actual sweep (white).
- MAX-HOLD --- The display shows each actual sweep (white) and the maximum values which were found since this mode was enabled (red).
- MIN-HOLD --- The display shows each actual sweep (white) and the minimum values which were found since this mode was enabled (cyan).
- MIN/MAX-HOLD --- The display shows each actual sweep (white) and both, the minimum (cyan) and the maximum (red) values.
- AVG --- The display shows each actual sweep (white) and the averaged values of all sweeps since this mode was enabled. The annotation in the display marking the AVG mode is followed by the number of sweeps already averaged.
These display functions are implemented locally in the spectrum display window and therefore not visible at the spectrum analyzers 'physical' display. The setting which control the display mode however is a common parameter of the spectrum analyzer driver. As a consequence, changing the display mode parameter changes the display at all places where the display of this spectrum analyzer is watched. Also the display mode setting may be stored as a part of a device preset.
Preset handling
Settings of a spectrum analyzer may be stored in two different ways:
The fist method is to store the device setting in one of the memories in the device itself. The paragraph "Display window pages" above describes how to do this. The advantage of this method is, that the spectrum analyzer stores all it's settings and also restores all of them when the preset gets recalled. The disadvantage if this method is, that cannot apply such a stored setup to another device.
Beside this, the csm spectrum analyzer driver provides the standard sat-nms device preset method in a slightly modified way, optimized for a spectrum analyzer's behaviour. If you store a device preset, all those "coupled functions" parameters are skipped which are marked as AUTO. When the preset gets applied, such a parameter is not explicitly set, the spectrum analyzer itself chooses the proper value for this parameter. Additionally the parameters of a device preset are applied in a sequence which corresponds to the dependencies of "coupled functions" parameters.
The advantage of this method is, that sat-nms device presets are stored at a central place, a preset recorded with one device may be applied to any other one. As the csm spectrum analyzer driver only implements a "standard" subset of spectrum analyzer parameters, recorded presets are mostly compatible between devices from different vendors. However, you should be aware that applying a sat-nms device preset only sets a couple of parameters at the device, it does not recall a complete setup like the internal memory function of the spectrum analyzer does. In some cases it may be necessary to apply a "INSTR PRESET" first, to initialize the spectrum analyzer to a defined state.
How to configure the driver
As mentioned above, the CSM-Spectrum-Analyzer device driver uses the interface handling of the sat-nms CSM software to access the spectrum analyzer. From the VLC's point of view, the driver behaves like a 'logical' device, without using any physical interface. In practice, configuring a CSM-Spectrum-Analyzer device is done as follows:
- In the device setup window define a 'null' interface running the 'Logical' protocol for each spectrum analyzer you want to control. For best performance, each device should be assigned to an interface of it's own. To achieve a fast display update, you should tune the idle time setting. The recommended idle time depends on the speed of the client-server network connection:
| Ethernet |
100 msec |
| ISDN 64kbps |
1000 msec |
| Modem / analog telephone line |
2000 msec |
Larger idle times slow down the maximum sweep refresh rate of the driver, thus minimizing the risk of buffer overflows through slow communication lines. If the spectrum analyzer seems to respond to parameter changes after only some sweeps delayed, you should increase the idle time. The same applies if the client server connection breaks after some time. 2. At the maintenance page / setup dialog, select the type of spectrum analyzer to control. 3. At the 'address' field, type in the interface / address specification.
Fixed LO frequency
At the maintenance / setup page you can configure the driver to control an input switch in front of the spectrum analyzer and an individual LO frequency for each switch position.
If there is no input switch, but nevertheless you want to translate the frequency reading, you may 'fake' an input switch with one single position.
Example: The Antenna receives Ku-band, the spectrum analyzer is connected beyond an LNB with an 10GHz LO. To make the spectrum analyzer show the center / marker frequencies in terms of Ku-band rather than L-band, configure the input switch parameters as follows:
- inputSelId: --- SP.info.port
- inputNames: --- null
- inputLoFreqs: --- 10000
The example above assumes, that the device name of the spectrum analyzer is 'SP'. It uses it's communication port description as a dummy input switch parameter ID. With a CSM spectrum analyzer device this always reads 'null', hence always the 10000MHz LO frequency are applied as specified in the 'inputLoFreqs' field.
CSM address specification
The CSM software (and therefore the CSM-Spectrum-Analyzer driver) knows three major interface types to control a device. They are:
- RS232 --- Serial interfaces are provided by the Advantest spectrum analyzer and by some models of the Agilent ESA units. The disadvantage of this common interface type is the comparable low speed. Even with 100 msecs idle time the best sweep rate that can be achieved is about 2 sweeps per second.ttyS1:19200,8,N,1For a serial interface, the (Linux-) device name of the serial interface, followed by a colon and the interface settings have to be filled into the 'address' field of the setup dialog (like the example above). When using a terminal server which is recommended for baud rates above 19200, the address field must contain the IP address of the terminal server, followed by a colon and the port number. Example:192.168.100.100:4001
- GPIB --- The sat-nms software supports the use of GPIB with the ENET100 network to GPIB interface by National Instruments and with the Prologix Ethernet to GPIB controller. The address specification for a GPIB controlled device looks like this (for the ENET100):gpib0:13The keyword 'gpib0' addresses the first ENET100 interface known to the VLC. The number following the colon character denotes the GPIB address of the device.With the Prologix GPIP adapter the address specification looks like this:gpibx:10.0.0.1:13'gpibx' tells the software that a Prologix adapter is used, 10.0.0.1 is the IP address of the adapter. Finally, 13 is the GPIB address of the spectrum analyzer as in the example above.
- NI-VISA --- The Rohde & Schwarz FLS-3 spectrum analyzer is controlled using the VISA instrument control library by National Instruments. The sat-nms software uses a program called visaproxy to access the spectrum analyzer. The visaproxy must be configured as described at the end of this chapter. The address specification for a visaproxy device looks like this:visaproxy:localhost:5000The keyword visaproxy tells the software about this type of interface. The second field designates the host name or IP address where the visaproxy service runs (usually localhost ). Please note that this address is not the IP address of the spectrum analyzer. The latter is set at the visaproxy configuration as described below. The last field defines the port number at which the visaproxy listens. Out of the box, the sat-nms software uses port 5000 for the first spectrum analyzer, 5001 for the second, and so on.
The visaproxy configuration
When controlling NI-VISA devices, the sat-nms software does this through a network service called visaproxy . Before the sat-nms software can access a spectrum analyzer through this service, it must be configured with the device address.
This is done by editing the file 'visaproxy.setup' in the VLC's home directory. With a sat-nms system out of the box this file looks like this:
#
# /home/satnms/visaproxy.setup
#
# Example for the contents of the visaproxy configuration file.
# The file must be copied to the location mentioned above.
#
# The configuration file is read by the visaproxy startup script,
# defines which visaproxy instances are launches at system start.
# It must define two shell variables:
#
# PORTNO      The IP port number of the first instance that is
#             started. Subsequent instances each increment the
#             port number by 1
#
# INSTRUMENTS The VISA resource descriptions if the instruments
#             to serve, separated by space characters. Actually
#             the sat-nms software only supports TCPIP / VXI-11
#             based VISA instruments, hence the resource
#             descriptions all look like TCPIP::aaa.bbb.ccc.ddd
#
# The example below defines two instances of the visaproxy,
# the first proxy makes the instrument TCPIP::192.168.1.1
# accessible at port 5000, the second one instrument
# TCPIP::192.168.1.2 at port 5001
#
#
# PORTNO=5000
# INSTRMENTS="TCPIP::192.168.1.1 TCPIP::192.168.1.2"
To activate the visaproxy network service, remove the comment characters in front of the last two lines of the file and edit the INSTRUMENTS list of spectrum analyzer addresses for your need. Normally there is no need to change the PORTNO definition. Then save the file and re-boot the VLC. After starting up, the VLC will run a visaproxy service for each of the configured addresses.
Troubleshooting a GPIB ENET100 interface
The ENET100 GPIB interface has been reported to block the communication to the spectrum analyzer under certain conditions. To fix this problem, perform a system restart with the following sequence of operations:
- Shut down the M&C computer.
- Switch off the spectrum analyzer and the ENET100 interface box.
- Switch on the spectrum analyzer.
- Switch on the ENET100 interface box.
- Finally switch on the M&C computer again.
After booted up, the sat-nms software now should recognize the spectrum analyzer again.
LP Technologies LPT3000
The LPT3000 is an exclusively remote controlled spectrum analyzer with no internal display. Hence the configuration parameters concerning the local display are not applicable with this device.
The CSM device driver controls the LPT3000 using TCP/IP. You have to setup the address field as described above for a RS232 terminal server. For a LPT3000 at the IP address 10.0.0.1 the address field would be "10.0.0.1:5000", the LPT3000 always listens at port 5000.
Unlike other spectrum analyzers, the LPT3000 provides an input selection switch (4:1) which can be controlled through the sat-nms software. The 'input' Parameter of the device reflects the actual input selection (1 .. 4), the parameter also may be used to control the input selection. To configure this for a spectrum analyzer device called "SPA", setup the configuration variables at the SPA device as follows:
- 'inputSelId' must be set to 'SPA.input', this makes the spectrum analyzer driver watch it's own input selector.
- 'inputNames' must be set to '1,2,3,4' which are the possible input selections.
- 'inputLoFreqs' must be set to the list of LO frequencies applying to the inputs 1 .. 4 (in that order).
You may want to control the input selector with user defined names for the switch position. To achieve this, set up a Choice-Translator device to do the name translation.
Variables defined by this device driver
| info.driver |
TEXT |
R/O |
StringRange R/O |
| info.type |
TEXT |
R/O |
StringRange R/O |
| info.port |
TEXT |
R/O |
StringRange R/O |
| info.frame |
TEXT |
R/O |
StringRange R/O |
| info.revision |
TEXT |
R/O |
StringRange R/O |
| info.screen |
TEXT |
R/O |
StringRange R/O |
| info.memories |
TEXT |
R/O |
StringRange R/O |
| info.sweepsPerSec |
FLOAT |
R/O |
DoubleRange R/O (0.0 .. 0.0) |
| info.pdfilter |
TEXT |
R/O |
StringRange R/O |
| config.display |
CHOICE |
SETUP |
EnumRange (OFF ON) |
| config.dispTimeout |
INTEGER |
SAVE SETUP |
IntegerRange (0 .. 60) |
| config.model |
CHOICE |
SAVE SETUP |
EnumRange (FscSpectrumAnalyzer Fsl3SpectrumAnalyzer FsvSpectrumAnalyzer FshSpectrumAnalyzer FphSpectrumAnalyzer AgilentSpectrumAnalyzer AdvantestSpectrumAnalyzer LPT3000SpectrumAnalyzer LPT3000RX4SpectrumAnalyzer NardaSpectrumAnalyzer DecimatorD4SpectrumAnalyzer) |
| config.inputSelId |
TEXT |
SAVE SETUP |
StringRange |
| config.inputNames |
TEXT |
SAVE SETUP |
StringRange |
| config.inputLoFreqs |
TEXT |
SAVE SETUP |
StringRange |
| config.title |
TEXT |
SAVE SETUP |
StringRange |
| address |
TEXT |
SAVE |
StringRange |
| internal.tick |
TEXT |
R/O |
StringRange R/O |
| title |
TEXT |
R/O |
StringRange R/O |
| input |
INTEGER |
|
IntegerRange (0 .. 0) |
| center |
FLOAT |
|
DoubleRange (0.000000 .. 0.000000) |
| span |
FLOAT |
|
DoubleRange (0.000000 .. 0.000000) |
| span.full |
TEXT |
NOPRESET |
StringRange |
| span.dn |
TEXT |
NOPRESET |
StringRange |
| span.up |
TEXT |
NOPRESET |
StringRange |
| start |
FLOAT |
NOPRESET |
DoubleRange (0.000000 .. 0.000000) |
| stop |
FLOAT |
NOPRESET |
DoubleRange (0.000000 .. 0.000000) |
| reflev |
FLOAT |
|
DoubleRange (0.00 .. 0.00) |
| reflev.up |
TEXT |
NOPRESET |
StringRange |
| reflev.dn |
TEXT |
NOPRESET |
StringRange |
| scale |
FLOAT |
|
DoubleRange (0 .. 0) |
| scale.up |
TEXT |
NOPRESET |
StringRange |
| scale.dn |
TEXT |
NOPRESET |
StringRange |
| atten |
FLOAT |
|
DoubleRange (0 .. 65) |
| atten.auto |
CHOICE |
|
EnumRange (AUTO FIX) |
| preamp |
CHOICE |
|
EnumRange (OFF ON) |
| rbw |
FLOAT |
|
DoubleRange (0.000 .. 0.000) |
| rbw.up |
TEXT |
NOPRESET |
StringRange |
| rbw.dn |
TEXT |
NOPRESET |
StringRange |
| vbw |
FLOAT |
|
DoubleRange (0.000 .. 0.000) |
| vbw.up |
TEXT |
NOPRESET |
StringRange |
| vbw.dn |
TEXT |
NOPRESET |
StringRange |
| sweep |
FLOAT |
|
DoubleRange (0.004 .. 4000.000) |
| rbw.auto |
CHOICE |
|
EnumRange (AUTO FIX) |
| vbw.auto |
CHOICE |
|
EnumRange (AUTO FIX) |
| sweep.auto |
CHOICE |
|
EnumRange (AUTO FIX) |
| trigger |
CHOICE |
SAVE |
EnumRange (CONT SINGLE) |
| trace |
GENERIC |
R/O |
ObjectRange R/O generic object |
| sweeping |
TEXT |
R/O |
StringRange R/O |
| display |
CHOICE |
|
EnumRange (NORM MAX HOLD MIN HOLD MIN/MAX HOLD AVG) |
| marker.x |
FLOAT |
R/O |
DoubleRange R/O (0.000000 .. 0.000000) |
| marker.y |
FLOAT |
R/O |
DoubleRange R/O (0.00 .. 0.00) |
| marker.xpos |
INTEGER |
|
IntegerRange (0 .. 0) |
| marker.mode |
CHOICE |
|
EnumRange (OFF ON) |
| marker.peak |
TEXT |
NOPRESET |
StringRange |
| marker.nextPeak |
TEXT |
NOPRESET |
StringRange |
| marker.toCenter |
TEXT |
NOPRESET |
StringRange |
| marker.toReflev |
TEXT |
NOPRESET |
StringRange |
| foffs |
FLOAT |
SAVE |
DoubleRange (0.000000 .. 0.000000) |
| foffs.en |
CHOICE |
SAVE |
EnumRange (OFF ON) |
| loffs |
FLOAT |
SAVE |
DoubleRange (0.00 .. 0.00) |
| loffs.en |
CHOICE |
SAVE |
EnumRange (OFF ON) |
| dl.x1.val |
FLOAT |
SAVE |
DoubleRange (0.000000 .. 0.000000) |
| dl.x1.en |
CHOICE |
SAVE |
EnumRange (OFF ON) |
| dl.x2.val |
FLOAT |
SAVE |
DoubleRange (0.000000 .. 0.000000) |
| dl.x2.en |
CHOICE |
SAVE |
EnumRange (OFF ON) |
| dl.y1.val |
FLOAT |
SAVE |
DoubleRange (0.00 .. 0.00) |
| dl.y1.en |
CHOICE |
SAVE |
EnumRange (OFF ON) |
| dl.y2.val |
FLOAT |
SAVE |
DoubleRange (0.00 .. 0.00) |
| dl.y2.en |
CHOICE |
SAVE |
EnumRange (OFF ON) |
| reset |
TEXT |
NOPRESET |
StringRange |
| store |
TEXT |
NOPRESET |
StringRange |
| recall |
TEXT |
NOPRESET |
StringRange |
| memname.0 |
TEXT |
SAVE |
StringRange |
| memname.1 |
TEXT |
SAVE |
StringRange |
| memname.2 |
TEXT |
SAVE |
StringRange |
| memname.3 |
TEXT |
SAVE |
StringRange |
| memname.4 |
TEXT |
SAVE |
StringRange |
| memname.5 |
TEXT |
SAVE |
StringRange |
| memname.6 |
TEXT |
SAVE |
StringRange |
| memname.7 |
TEXT |
SAVE |
StringRange |
| memname.8 |
TEXT |
SAVE |
StringRange |
| memname.9 |
TEXT |
SAVE |
StringRange |
| memname.10 |
TEXT |
SAVE |
StringRange |
| memname.11 |
TEXT |
SAVE |
StringRange |
| memname.12 |
TEXT |
SAVE |
StringRange |
| memname.13 |
TEXT |
SAVE |
StringRange |
| memname.14 |
TEXT |
SAVE |
StringRange |
| memname.15 |
TEXT |
SAVE |
StringRange |
| faults.99 |
ALARM |
R/O |
AlarmFlagRange R/O (Communication) |
| faults.commstat |
TEXT |
R/O |
StringRange R/O |