The sat-nms M&C software provides a facility (a logical device) called File-Recorder which is capable to record arbitrary data like levels, antenna pointing etc. into a disc file. The History File Viewer is the user interface to inspect such files. The window can be accessed either from the File-Recorder's device window or can be used as a stand alone application as well (see below for details).
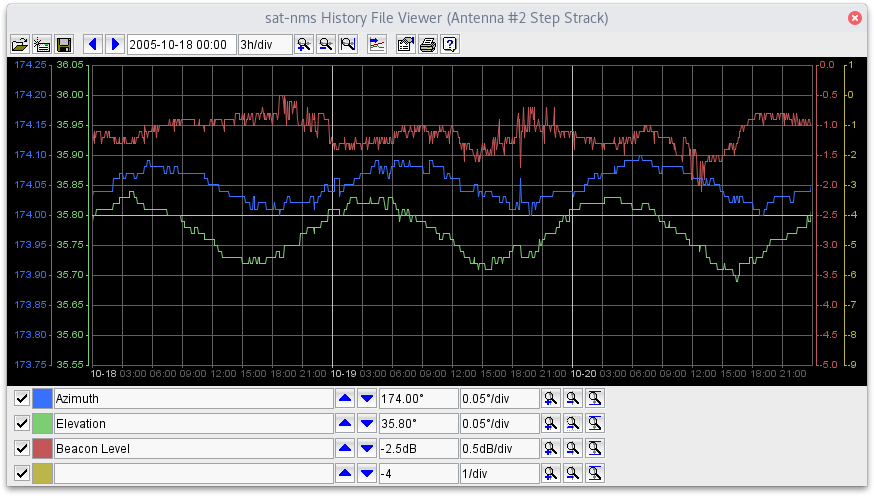
The window shows a diagram of the recorded data, the fields and buttons in the tool bar permit to modify the appearance of the diagram as needed. Clicking into the diagram shows a marker which displays a readout of the value at the selected screen position.
Top Toolbar
 --- Loads a file from a local disc. Opens a standard file select dialog. You may use this to display files you have archived on you local PC.
 --- Gets a file directly from a remote sat-nms M&C. When you started the History File Viewer from within the sat-nms GUI, it usually will already display the data you want to see on startup. If you started the file viewer as a stand alone application, you use this function to connect to a M&C system and get the data from there.
 --- Saves / archives the recorded data as a disc file to the local computer. A file select dialog is shown where you can select or enter the name of the file to save. The file format is text based, saved files can be re-opened with the open icon in the tool bar. The textual format of the file also permits to process the saved data with a spreadsheet program or with gnuplot.
 --- Moves the plot two divisions to the left, lets you see older data.
 --- Moves the plot two divisions to the right, lets you see younger data.
 --- Shows/edits the start time. The displayed time corresponds to the leftmost grid line in the diagram. You set the start time by changing the value with the keyboard and then pressing ENTER or you may double-click to the field which displays a small calendar window which lets you select a another date in a comfortable way. When you change the start time, you should consider, that the software always aligns the value that in fits into the grid of the time scale. This means if e.g. the time scale is 1 hour/div, a start time entered gets always aligned to a full hour.
 --- Zooms in the time scale, shows a smaller section of the data more detailed.
 --- Zooms out the time scale, shows a larger section of the data.
 --- Zooms out to show the entire plot. Please note, that the largest available scale shows 720 days (30d/div). If the data you are displaying covers a larger time span, you will not see the complete data even after zooming out fully.
 --- toggles live view / normal mode (see paragraph "Live view mode" below for details).
 --- Opens the trace properties dialog window (see below for details).
 --- Prints the diagram as actually shown.
 --- Shows this manual page.
Bottom Toolbars
Below the diagram, the History File Viewer provides four toolbars to modify the scaling of the up to four traces shown in the diagram.
 --- The first control in each toolbar selects if the trace shall be drawn.
 --- Shows the color if this trace, clicking to the color fields opens a dialog which lets you change the color of the trace. --- Shows the name / description of the trace. When called directly from the File-Recorder device screen, the History File Viewer shows the IDs of the recorded parameters here, "Trace n" if the trace name is not known. Trace names may be set by the operator and saved on the M&C server, see the paragraph about adapting the diagram properties below.
 --- Moves the trace upwards one division.
 --- Moves the trace down one division --- Shows the y-scale reference level and the actual scaling. The y-reference level is the value corresponding to middle grid line.
 --- Zooms in the y-scale for this trace.
 --- Zooms out the y-scale for this trace.
 --- Zooms to show the min/max values (autoscale). This refers to the entire data, not only to the part actually shown.
Getting data directly from a M&C system
The history file viewer is capable to get the data to tisplay directly from a remote sat-nms M&C system. This feature can be used also if the viewer has been started as a stand alone application.
Clicking to the button in the tool bar opens the remote load dialog window. In this window, enter the IP address of the M&C computer you want to read from and click to the button right beside the entry field.
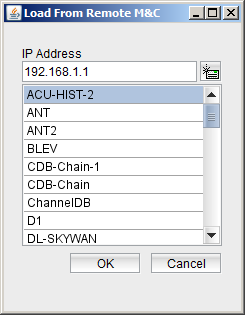 --- The selection list field now shows 'connecting ...' and after a couple of the seconds, the files which look like File-Recorder data files are displayed in the the selection box. Select the file (the name of the File-Recorder logical device) you want to load an click to 'OK'.The histoy file viewer in this case loads both files belonging to the File-Recorder device if they are available. If you load the data from a File-Recorder named FREC1, the file viewer tries to get the files FREC.old.txt and FREC.txt and concatenates them in memory.
If the file recorder is not able to read from the remote M&C system, the 'connecting ...' notice remains visible permanently. In this case verify the IP address you entered, close the window and try again.
Live view mode
Beside for viewing stored log files, the History File Viewer can be used to display the logged data as it is acquired with an automated display update. By pressing the "live view" toggle button in the toolbar, the viewer changes to live view mode. In this mode the viewer shows up to 400 recent data points, automatically updated with an interval that is configurable separately from the standard interval at the File-Recorder device setup page.
Due to the automatic display update, the viewer and its autoscale functions behave slightly different in live view mode:
To leave live view mode, click the "live view" toolbar button again. The viewer re-reads the full history data and performs an autoscale.
Adapting the diagram properties
The in the tool bar opens the trace properties dialog window. This dialog lets you set the name of each trace, the unit which shall be displayed with the scaling information fo each trace and a diagram title. The latter is shown in the diagram window title bar and also above the plot in the printout.
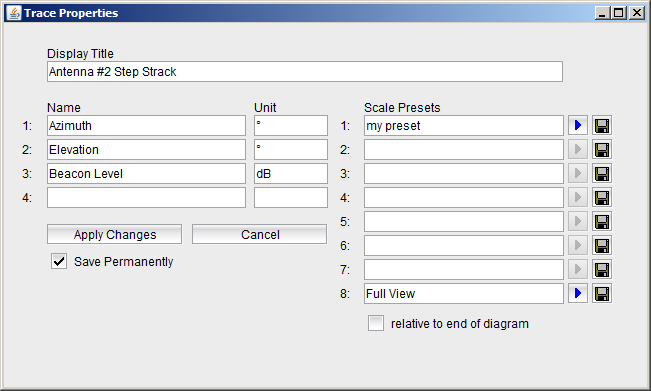
If you select the 'save' option, the trace properties are written to file named like the data file, but with the suffix '.frv'. The file is written to the same place where the data file was loaded from. When you load this data file the next time, the saved trace properties are used automatically.
The Trace Properties dialog also lets you save and recall up to 8 scaling presets. These presets may help you recall certain settings of y/t scaling.
--- Stores the name of the preset, the color of each trace, if the trace shall be drawn or not and the actual scale settings to the given preset memory. The presets are stored together with the trace names in the '.frv' file on the M&C server. --- Recalls this preset, restores the trace color, the trace enable state and the scale settings from the stored values. If the preset wasn't set before, the preset recall button is inactive.
If you check the mark below the preset list before recalling a preset, the start time of the diagram is set relative to diagram end. This means, the start time stored in the preset is ignored, the start time is set to show the recent data in the diagram.
Zooming to the cursor position
When you zoom the time axis of the diagram using the ool bar buttons, the viewer tries to keep the start time of the diagram constant. If you want to have a more detailled look on a certain event, the event you want to zoom to will probably move out tof the visible part of the display. To zoom to certain position on the time axis, hold down the SHIFT key and click to the position you want to zoom to. Holding the CTRL key while clicking works the other way round, the plot gets zoomed out.
Starting the viewer as a stand alone application
Assuming your sat-nms client software is installed at 'c:\satnms', the command line to start the history viewer is for a windows based computer:
java -cp client.jar satnms3.gui.FiledRecordFrame
You may add this command as a start menu entry or as a desktop icon to your working environment.