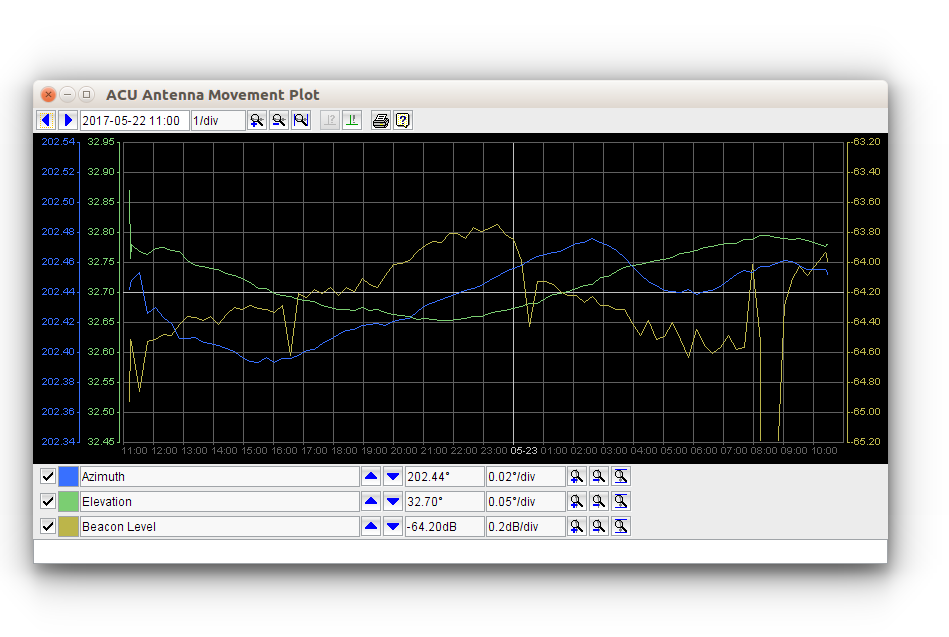
The sat-nms ACU IDU software provides a facility that permits to display the recorded tracking data in a versatile Y/T diagram viewer. This viewer may be launched by clicking to the "Y/T Plot" button either in the ACU Main Screen or in the device screen of the Satservice ACU-ODM.
The window shows a diagram of the recorded tracking data, the fields and buttons in the tool bar permit to modify the appearance of the diagram as needed. Clicking into the diagram shows a marker which displays a readout of the value at the selected screen position in the status bar at the bottom of the screen.
Top Toolbar
 --- Moves the plot two divisions to the left, lets you see older data.
 --- Moves the plot two divisions to the right, lets you see younger data.
 --- Shows/edits the start time. The displayed time corresponds to the leftmost grid line in the diagram.
 --- Zooms in the time scale, shows a smaller section of the data more detailed.
 --- Zooms out the time scale, shows a larger section of the data.
 --- Zooms out to show the recent 24 hours of recorded data.
 --- If pressed (it's a latching button), the search step beacon degradation is shown together with the beacon level. This function is not available with the SatService ACU-ODM.
 --- If pressed, the AZ/EL pointing determined by the peaking algorithm are shown as a second curve. The main curve shows the pointing angles where the antenna was moved to, including and optimization or smoothing applied.
 --- Prints the diagram as actually shown.
 --- Shows this manual page.
Bottom Toolbars
Below the diagram, the History File Viewer provides three toolbars to modify the scaling of the traces "Azimuth", "Elevation" and "Beacon Level" shown in the diagram.
 --- The first control in each toolbar selects if the trace shall be drawn.
 --- Shows the color if this trace, clicking to the color fields opens a dialog which lets you change the color of the trace. --- Shows the name / description of the trace.
 --- Moves the trace upwards one division.
 --- Moves the trace down one division --- Shows the y-scale reference level and the actual scaling. The y-reference level is the value corresponding to middle grid line.
 --- Zooms in the y-scale for this trace.
 --- Zooms out the y-scale for this trace.
 --- Zooms to show the min/max values (autoscale). This refers to the entire data, not only to the part actually shown.