1.25.3 Event report
The Event Report window lets you generate filtered reports from the event database. This database contains all event messages issued by the MNCs or backend services during the last months. The exact depth of event storage is configurable, see chapter EDB.properties. The default retention time for the event log is 365 days.
The event report shown in the table gets automatically updated when you change the time range or apply other filter to display or the sort order. This lets you combine various filter specifications without being interrupted by the generation of intermediate reports.
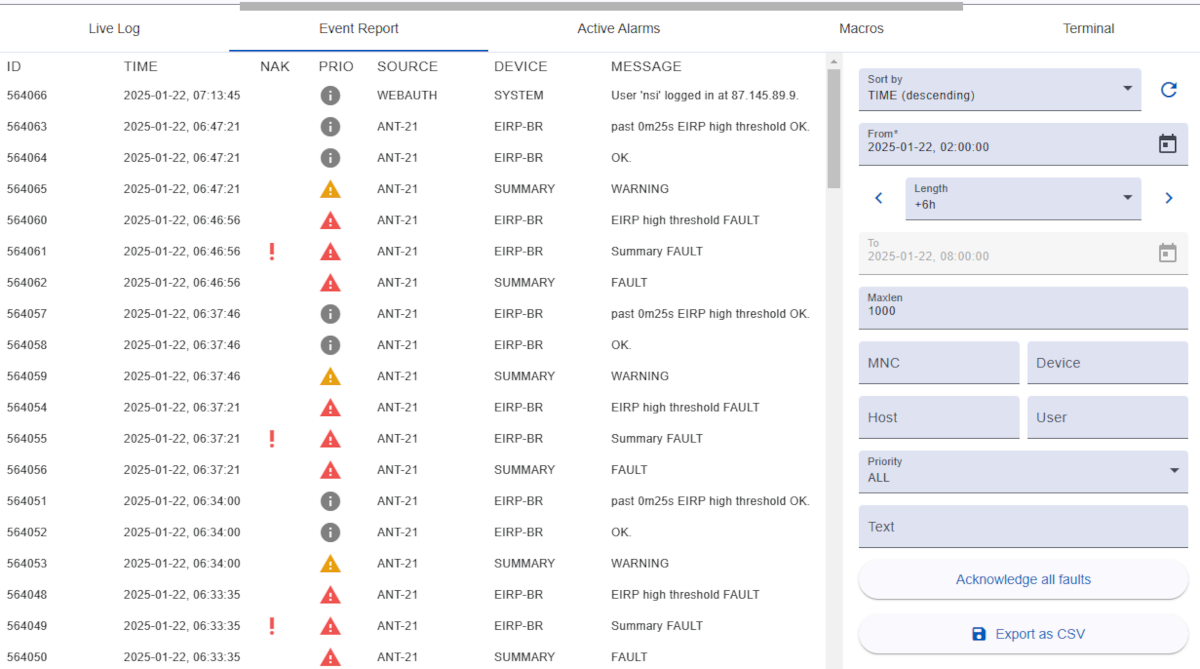
Table columns
- ID: The event ID. This is a unique number the software assigns to each event which arrives at the M&C.
- TIME: The time stamp when the event was originated
- NAK: The need acknowledgment mark. Messages showing a red exclamation mark in this column are fault messages which need to be acknowledged by the operator.
- PRIO: The message priority or severity. It also is a search criteria in the Event Report window. The following priority symbols may appear:
 This is an informational message (lowest priority)
 This is a warning message (medium priority)
 This is an fault message (high priority)
 This is an critical message (highest priority)
- SOURCE: The primary message source. This usually is the ID of the MNC or
BACKEND for events coming from a backend service or WEBAUTH for messages related to user authentication.
- DEVICE: The secondary message source. This gives a more detailed information about the source of the message. It is usually the name of the device in a MNC which caused the event. For messages from backend or authentication service the value is
SYSTEM.
- MESSAGE: The message text which describes the full details of the event.
Filter functions
Located on the right side of event report tab. All filter can be combined with each other.
- Sort by: The table content can sort by descending and ascending of it's time.
- Reload button: Reload the table content to get latest data.
- From: Define the start time. If you click on the calendar icon on the right-hand side, a calendar view for selecting the date is displayed. The time must be entered manually.
- Length: The length is a drop-down menu that allows you to select duration. If you click on the arrow button on the right or left, the hours are added (on right arrow) to or subtracted (on left arrow) from the start time.
- To: Define the end time. Normally this input field is disabled to activate, please select 'select end time' from length dropdown.
- Max.length: Define the maximum number of events that a report may contain. There is a default value for this (1000 in most cases), which represents a good compromise between performance and the number of events displayed simultaneously. You can change this limit according to your needs, but remember: reports with millions of events can take some time.
- MNC: This filter lets you filter with the M&C name.
- Device: This filter lets you filter messages along their device (secondary source) which caused the message.
- Host: The host name filter lets you restrict the report to messages originated from a certain client PC. Login messages and messages logging the active change of a parameter are stored with the origin (hostname or IP4 address) of the event.
- User: Lets you restrict the report to messages originated by a certain user. Login messages and messages logging the active change of a parameter are stored with the name of the user who is responsible for this event.
- Priority: The priority selector defines the priority (or type) that an event must have in order to be listed in the report.
- Text: Filter with the message text.
| ALL |
all events |
| INFO-ONLY |
events with info priority only |
| WARNING |
events that have warning priority or higher |
| WARNING-ONLY |
events with warning priority only |
| FAULT |
events that have fault priority or higher |
| FAULT-ONLY |
events with fault priority only |
| ALARM |
events that have alarm priority |
| NOT-ACK |
not acknowledged faults or alarms |
The following buttons provide additional functions:
- Acknowledge all faults: Acknowledge all faults marked with the red exclamation mark.
- Acknowledge fault: This button may appear if you want to acknowledge messages marked with the red exclamation mark. Simply select the row with red exclamation mark with mouse click. The exclamation mark will then disappear and a confirmation message will be added at the end of the log.
- Export as CSV: This button downloads the current event report, as displayed in the table, as a CSV file.