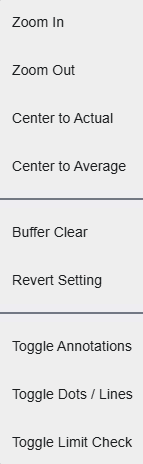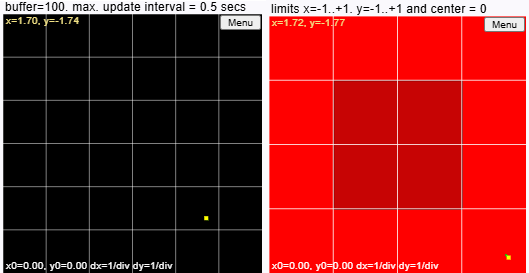
This element shows the relation of two numeric variables in an X/Y diagram, featuring a 'trace' which shows the recent history of the values with a configurable depth. The update rate, the diagram scaling and much more is configurable with this screen element.