The chart element shows a strip chart of a numeric parameter. The chart element keeps a local history of the received values, advances with a constant speed of 1 pixel / second. The default y-scale is 1/division but may be changed by clicking to the chart with the right mouse button.
By default, the strip chart element lets the y-scale offset follow the displayed value that the recent measurement samples are shown in the diagram. This behavior is optimized for applications where the strip chart shall indicate a 'trend' for the displayed value, using an element height of only 50 pixels or less.
Display Modes
The ChartElement uses different display and scaling modes, depending on the display mode defined in mode. The table below lists the defined display modes an their behavior.
| mode | Description |
|---|---|
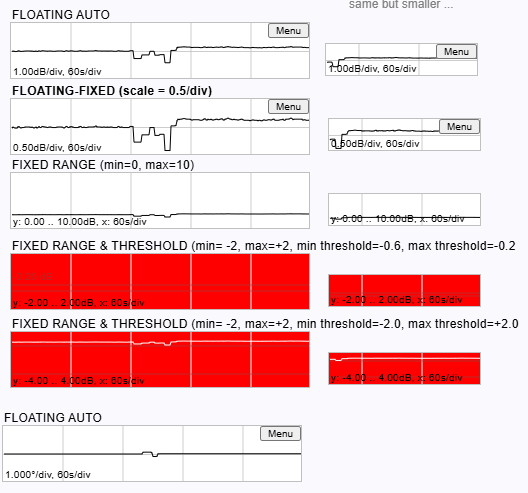
| FLOATING-AUTO | Does a full autoscale. The y-offset of the strip chart is set that the newest value displayed appers at the middle of the y axis. The chart y-scale is evaluated in a 1-2-5 raster to the finest scale that allows all points in the history to be displayed in the chart area. All scaling parameters are ignored. |
| FLOATING-FIXED | Evaluates the y-offset like in FLOATING-AUTO, but applies a fixed y-scale as defined in scale. The scale value is 1/div and chart height is assumed as 2 divisions. So, the top line of the chart corresponds to y-offset + scale, the bottom line to y-offset - scale. |
| FIXED | Sets a fixed y-range from the minValue / maxValue parameters. |
| FIXED-THRESHOLD | Like FIXED, but also checks every new value against the minThreshold / maxThreshold limits. If outside the limits, the chart background turns to red. |