1.16.2.4.16 Gauge (Bar Graph)
The Gauge display element shows a numeric parameter value as a horizontal bar in an entry field like frame. The gauge element is capable to adjust the scale factor for the gauge automatically from the parameter's range definition. Alternatively the scale parameters may set explicitly.
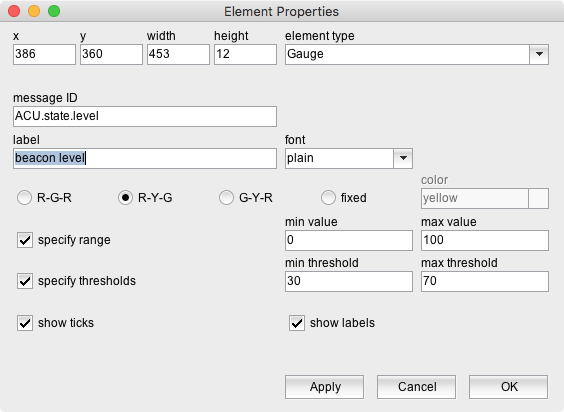
The attributes listed below may be configured to customize a display element of this type:
- message ID --- The message ID addresses the parameter the element shall display. The message ID consists of the device name followed by a colon and the name of the parameter. XMIT-1.tx.on for example addresses the variable tx.on at a device named XMIT-1 . With the ' Device Driver Index ' in the appendix of this document there is a list of variable names provided for each device driver the software supports.
- label --- The label text drawn above the gauge / bar graph.
- font --- The font attribute applies to the label text shown above the gauge element.
- color scheme --- The gauge element knows three color schemes, allowing to change the bar color dynamically with the monitored value: | color scheme | description | | ---- | ---- | | R-G-R | RED/GREEN/RED The bar is displayed green while the value is between the minimum and maximum thresholds. If the value is outside the limits, the bar is displayed red. | | R-Y-G | RED/YELLOW/GREEN The bar is displayed red while the value is below the minimum threshold value. It changes to yellow if the value is between the minimum and maximum thresholds. If the value exceeds the maximum threshold, the bar color changes to green. | | G-Y-R | GREEN/YELLOW/RED The bar is displayed green while the value is below the minimum threshold value. It changes to yellow if the value is between the minimum and maximum thresholds. If the value exceeds the maximum threshold, the bar color changes to red. | | fixed color | The bar is displayed with the color defined with the field 'color'. |
Please note, unless you specify min/max thresholds for the monitored value, only the fixed color mode is available.
- color --- The bar color used with the fixed color scheme. Colors may be specified by standard color names like red / green / blue or using a hexadecimal RGB notation. '#FFFF00' for example specifies yellow. You may click to the color example field in order to open a color chooser dialog and select the color from there.
- specify range --- Check this mark to define the range which is displayed by the gauge element.
- min value --- The minimum value of the displayed range.
- max value --- The maximum value of the displayed range.
- specify thresholds --- Check this mark to define the threshold values which are used for RGR and GYR color schemes.
- min threshold --- The minimum threshold value.
- max value --- The maximum threshold value.
- show ticks --- check this mark to make the element show scale ticks vor the min/max and threshold values below the gauge.
- show labels --- With this mark checked, below the gauge element labeled ticks are shown for the min/max and threshold values. (requires "show ticks"). Bar graph elements with this option enabled should be configured with a width that is sufficient to show the scale labels without overlap.
Scaling and Threshold Display
Principally there are three ways to use a gauge element and to control the scaling of the display:
- The default behavior of the gauge element is to examine the display scaling from the range definition of the displayed variable. The scaling is set that the complete range of the variable is displayed. This works fine if the displayed variable comes with a properly set range definition. Some drivers however define the range of read only parameters as 0..0 (means 'don't know the limits') or as a extraneous wide range to avoid overflows. Variables with such range definitions will not display in a meaningful way. The default scaling does not provide any threshold monitoring or tick display.
- You may explicitly specify the display range with a range definition in the appropriate fields as described above. Such a definition overwrites the default scaling of the gauge element. You may include unit descriptions to the scale values, but you should consider, that long scale labels tend to overlap and become unreadable.
- If you let the gauge element monitor the 'gauge' status variable of a Level-Set logical device, this state variable will provide it's own display range and threshold definition. This replaces the default scaling and also a scaling explicitly defined for this element. The display range provided by the Level-Set device always includes threshold definitions, but does not turn on the display of labeled ticks under the bar graph. If you want to enable this, you have to specify a dummy display range and thresholds in the fields described above.