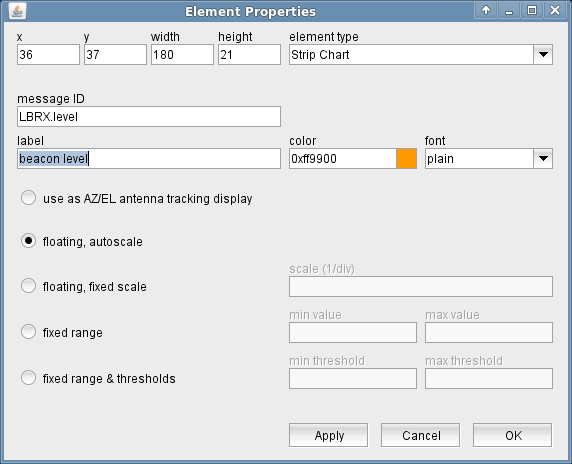
1.16.2.4.17 Strip Chart
The Strip Chart display element shows a strip chart of a numeric parameter. The chart advances with a constant speed of 1 pixel / second. The default y-scale is 1/division but may be changed by clicking to the chart with the right mouse button.
By default, the strip chart element lets the y-scale offset follow the displayed value that the recent measurement samples are shown in the diagram. This behavior is optimized for applications where the strip chart shall indicate a 'trend' for the displayed value, using an element height of only 50 pixels or less.
Optionally you may disable this variable scaling by defining fixed scale values in the 'Text / Image Name' field. With this fixed y-axis scaling an additional threshold check may be added, turning the chart background to red if the actual value exceeds the defined limits. When used with limit checking, the height of the chart should be at least 100 pixels.
The attributes listed below may be configured to customize a display element of this type:
- message ID --- The message ID addresses the parameter the element shall display. The message ID consists of the device name followed by a colon and the name of the parameter. XMIT-1.tx.on for example addresses the variable tx.on at a device named XMIT-1 . With the ' Device Driver Index ' in the appendix of this document there is a list of variable names provided for each device driver the software supports.
- label --- The label text drawn above the strip chart
- color --- Defines the pen color and the color of the label drawn above the chart. Colors may be specified by standard color names like red / green / blue or using a hexadecimal RGB notation. '#FFFF00' for example specifies yellow. You may click to the color example field in order to open a color chooser dialog and select the color from there.
- font --- The font attribute applies to the label text shown above the strip chart.
- display mode --- Selects the display mode of the strip chart element. Five modes are available:use as AZ/EL antenna tracking display The strip chart display element also may be used to place an Az/El diagram into a user interface for an Antenna-Tracking logical device. To do this, select this option and let the display element listen to the '.state.mode4' parameter of the Antenna-Tracking device. The Az/El diagram has a fixed size, you should align the display element size that the diagram is displayed properly.floating, autoscale This is the standard display mode. The strip chart aligns the reference value (the medium display line) in a way that every new display point is shown on this line. The initial scale is 1 unit/div.floating, fixed scale Works like the above mode, but the scale value gets initialized with a user defined value.fixed range The min/max values to display are defined explicitly, there is no automatic reference level alignment with this mode.fixed range & thresholds Like the above mode, but additionally there are min/max thresholds defined. If the actual value of the monitored parameter, the display background changes to red.
- scale --- The initial scale value used with the 'floating, fixed scale' mode.
- min value --- The minimum value to display for the fixed range display modes.
- max value --- The maximum value to display for the fixed range display modes.
- min threshold --- The lower threshold value for the "fixed range & thresholds" mode.
- max threshold --- The upper threshold value for the "fixed range & thresholds" mode.