
This feature provides a visual and analytical view of stored recorder data points defined in the recorder configs.
Recorder points are defined and stored based on the active recorder configuration. Once configured, these data points are continuously written to a TimescaleDB PostgreSQL database. The frontend feature queries this database and presents aggregated insights for each recorder point.
Top toolbar
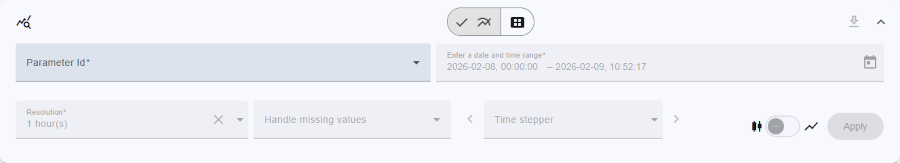
Query expansion panel
This is an expansion panel and can be expand or collapse. It has following functionality:
Toggle buttons to toggle between:
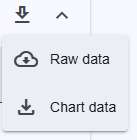
Download options (CSV)
Download options remain disabled until at least one parameter ID is selected.
Expansion panel control: Provides a button to expand or collapse the expansion panel.
Query form: This is the main section where data is queried. The following options are available:
NOTE: Data recorder page can also open directly from the Button element if the button action type is FREC‑VIEW and the M&C and Device ID are a parameter ID (MNC.DEVICE.state). It will fill the all forms and set the time range to the last 12 h.
Parameter Id: A dropdown that allows selection of one or more parameter IDs to be queried.
Date and time range: The start and end date-time for the query. By default, the range is set from yesterday at 00:00:00 UTC to the current UTC date and time.
Resolution: Defines the interval at which minimum, maximum, and average values are calculated and displayed. The system automatically recommends a resolution based on the selected time range, and the recommended option is always shown at the top. The resolution can be manually edited by typing a custom value. Some smaller units may be disabled and cannot be selected unless a different time range is chosen. If a resolution that is too high (more then 5000 points) or too low is selected, a warning message will be displayed.
Handle missing values: If data points are missing within the selected time range, one of the following handling methods can be selected:
Time stepper – Defaults to half of the selected time range; a numeric offset can be entered, with a dynamic unit dropdown (seconds, minutes, etc.); the right/left arrows instantly add or subtract that offset from the current range, updating the view without reopening the picker or pressing Apply.
Chart Display Options: Select how data is visualized:
Set Min/Max: Opens an dialogs to set min max for the chart.
Apply: Executes the query using the selected form values and shows the graph